 The Eloquence Development Environment
Tools windows are specialized application elements which provide
a specific task.
Toolwindows are permanent. When they are closed, they are merely
hidden, the content is retained.
Each Toolwindow has an associated menu item in the VIEW menu pane
to make them visible or invisible.
Additionally, each Toolwindow has an associated icon button in the
View toolbar window.
All log messages are displayed in the Output Window. The output Window
provides multiple views which can be toggled with the tab at the bottom
of the window. Depending on the type of the message, the apropriate
area is used. For example: When compiling a program, the "Build"
area is used to display any messages.

- Build - receives all compile messages
- Debug - holds TRACE messages while debugging
- Find in Files (currently unused)
Double clicking on an error message in the Build view positions the cursor
on the indicated line.
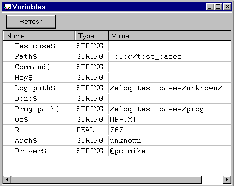
During a Debug session, the Variables Window displays the value of variables.
Arrays are displayed with a + sign in front and can be extended by a double
click on the variable name.

The variable value can be changed by double clicking on the variable value.
During a Debug session, the Call Stack Window displays the execution stack
of the executed programs. It contains a list of all segments which are
currently active. Double clicking on a line will set the cursor to the
indicated line.

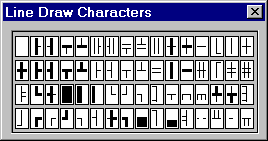
The Line Draw Characters Toolwindow is only accessible if the
"use enhancement characters" option is active for the current
file. Please refer to the Editor
settings for further reference.
By selecting a character image, the corresponding character
is inserted in the editor window.

© Copyright 1997 Hewlett-Packard GmbH. All rights reserved.
Revision: 98/02/18

 The Eloquence Development Environment
